
Standard session.
10W * stroke rate as the target power
10 minute blocks
Plan:

Results: About 0.7 sec fast on pace, and just about right on strokes (+4 for the whole workout)
Workout Summary - media/20161101-131736-sled_2016-11-01T06-47-09ZEDT.strokes.csv
--|Total|-Total-|--Avg--|Avg-|-Avg-|-Max-|-Avg
--|Dist-|-Time--|-Pace--|SPM-|-HR--|-HR--|-DPS
--|19719|83:09.0|02:06.5|18.5|144.9|162.0|12.8
W-|19482|80:00.0|02:03.2|18.4|144.8|162.0|13.2
R-|00242|03:09.0|06:30.6|17.1|128.3|162.0|09.2
Workout Details
#-|SDist|-Split-|-SPace-|SPM-|AvgHR|MaxHR|DPS-
01|02382|10:00.0|02:05.9|17.0|123.7|138.0|14.0
02|02437|10:00.0|02:03.1|18.4|139.9|145.0|13.2
03|02429|10:00.0|02:03.5|18.4|139.2|145.0|13.2
04|02448|10:00.0|02:02.5|18.7|145.6|149.0|13.1
05|02447|10:00.0|02:02.6|18.8|146.0|153.0|13.0
06|02451|10:00.0|02:02.4|18.9|152.5|156.0|13.0
07|02448|10:00.0|02:02.6|18.9|153.4|159.0|13.0
08|02439|10:00.0|02:03.0|18.5|158.4|162.0|13.2
In terms of effort, it felt great through the first 40 minutes, but when I added in the little 2 minute chunks at 200W, it seemed to really bury me. My HR climbed pretty hard in the last 30 minutes of the workout. This is a bit harder than I want to be working in these sessions. Next time, I will go back to just alternating 18s and 19s.


Since I have the enormous power of rowsandall.com at my finger tips, I decidedto do a bit deeper analysis of the row. This was an L4 workout so the power and stroke rate is closely prescribed. Here’s a view of the power versus strokes rate.

You can see that even though my averages were about right, that there is considerable variation in the power from stroke to stroke. I wonder if greater consistency in applied power at each stroke rate would be a sign of better efficiency?
Here’s a view of Drive Length versus stroke rate. 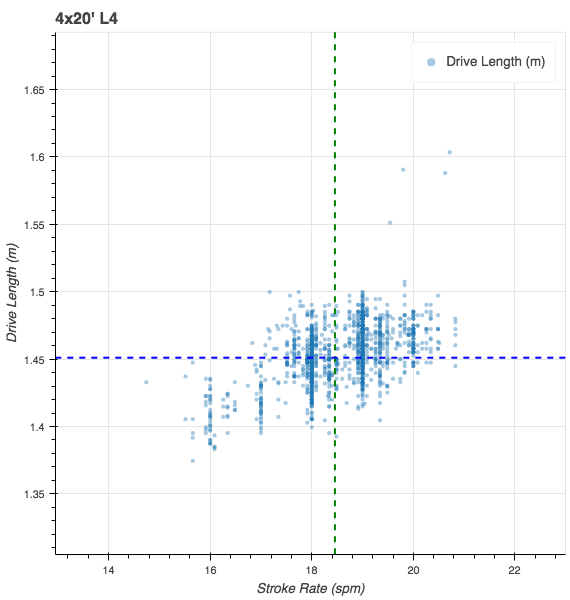
I would have thought that drive length would increase at lower stroke rates, but that is NOT what happened. You can see that my stroke actually gets shorter as the stroke rate decreases. I am also surprised at the variation from stroke to stroke, nearly 10 cm difference. Maybe a more repeatable stroke would be more efficient?
Now a look at peak and average force

I haven’t really sorted this one out. There is definitely a negative correlation between peak force and stroke rate, and a less pronounce relationship with average force. The spread is the thing that has me fascinated.
Finally, work per stroke. Basically “SPI”. This by the design of the workout should be pretty flat.

And it is. The interesting thing to me on this plot is that my consistency gets better as the rate increases.
I posted these for three reasons.
- It’s the beginning of erg season and I need a new way to keep myself entertained.
- I would like to find ways to get faster that I have not yet explored
- I would like to capture a baseline for the beginning of the season. Then in March, I can do this same workout and compare the graphs at the end of the season.
This afternoon, I am flying off to San Diego. Tomorrow will be a fitness center session, then another endurance session on Thursday morning after I get off the red eye.
Hopefully during the flight today I can figure out what my next objectives are and begin to lay down a training plan.

A few thoughts.
Perhaps it looks like you are more consistent at higher spm but there are also fewer data points. The workout histogram (not yet implemenented) should be able to give you a better feel for that.
For my own rowing, I suspect that the variations in stroke length are very much variations in lean back at the finish, as opposed to a longer reach at the catch. I see a weak negative correlation for my own workouts.
Once we get used to staring at these plots, we should derive a few meaningful metrics. The site will then calculate this for you.
Also, these plots are more meaningful with Painsled iOS than with ErgData or RowPro.
LikeLike
Thanks for your thoughts. We are definitely just starting to figure out how this kind of data can be useful.
I agree that the biggest inconsistency in my stroke is the amount of layback at the finish.
LikeLike
By the way, you can use the sliders for even more analysis. Perhaps the shorter strokes were later in the row?
LikeLike
I’ll give that a try. In other workouts I tend to see lower peak force and longer strokes as the workout goes along.
LikeLike